By Stephan Haggard and Yeilim Cheong
Polarization in Korea Part II: Divided Over What?
Politics is becoming somewhat more polarized in Korea, but more sharply among partisans than the general public. What is it that divides Korean voters?
In a previous post, we asked the question of whether the Korean electorate was becoming more polarized, looking at the ideological differences across all citizens and those who identified most strongly with the two major parties. Our findings were that politics was becoming somewhat more polarized, but more sharply among partisans than the general public. But what is it, exactly, that divides Korean voters? What are the issues that motivate them? Scandals and personal slurs may capture the headlines, and have contributed to the election being “the most unlikeable presidential election ever (역대급 비호감 대선).” According to a survey conducted by the National Election Commission and Gallup Korea earlier last month, 40.5% of recent survey respondents said the most important factor in their vote choice was candidate’s personal traits, competence, and moral integrity. Nonetheless, a considerable 35.1% mentioned policy and election pledges as their most important consideration.[1]
We do not have up-to-the-moment data on policy polarization, but we can provide some context about developments over the longer-run by looking at surveys conduct regularly at two year intervals for 2014, 2016, 2018 and 2020. The data thus covers the last years of the Park Geun-hye administration and the early years of Moon Jae-in’s presidency. In these surveys, respondents were asked whether they agreed or disagreed with a particular policy claim on an 11-point scale, with 0 being the strongest disagreement and 10 being the strongest agreement. We then plot the mean scores for those who self-identify as liberals, moderates, and conservatives and take the extent of policy differences between liberals and conservatives as an indicator of issue polarization: When differences are narrow, polarization on the issue is low; if differences are wide or widening, then we are witnessing deepening polarization. More information on the data is provided at the end of the post.
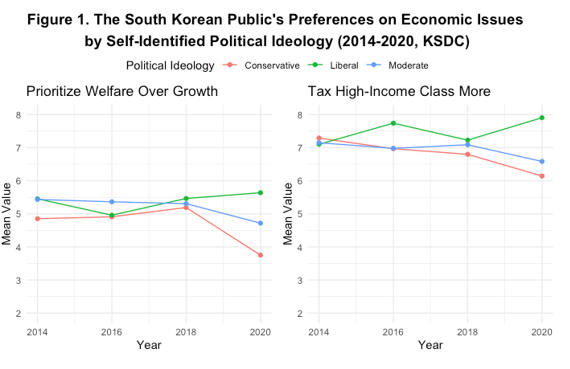
We start with a classic bread-and-butter issue: the need to prioritize welfare over economic growth (“경제성장보다는 복지에 더욱 힘을 기울여야 한다”). It has long been an observed feature of Korean politics that parties are not as divided on economic issues as one might think, and the data supports that observation through 2018. But in 2020 both moderates and particularly conservatives showed stronger disagreement with the proposition. It is also noteworthy that conservatives move more than liberals.
A second question gets at redistribution, asking whether high income people should be taxed more than they are now (“고소득자들이 지금보다 세금을 더 많이 내게 해야 한다”). Again, the lack of polarization on this issue is striking, as is the level of support for higher taxation of the rich. Liberals do show stronger support for the proposition in 2016, but in 2020 liberals and conservatives start to diverge more sharply. Although the movements are subtle, the moderates appear to follow the conservatives in showing declining support for taxing the rich.
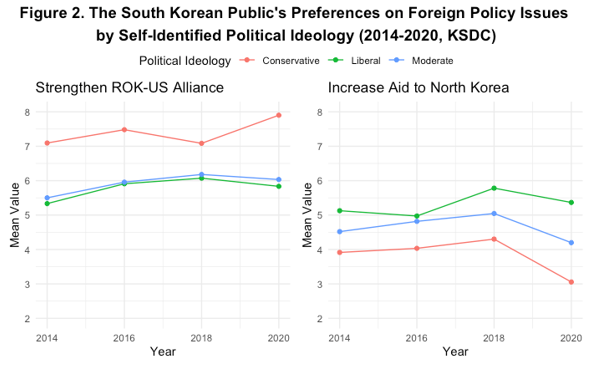
What about foreign policy? Such questions in Korean surveys are typically framed in two ways; whether to strengthen the alliance with the United States; and whether to engage more with North Korea, in this formulation by giving more aid. Here, we see greater divergence between liberals and conservatives. On the alliance, the question reads “the ROK-U.S. alliance should be strengthened further” (“한미 동맹관계를 더욱 강화해야 한다” or “한미 동맹관계를 지금보다 강화해야 한다”). Conservatives show a stronger preference for strengthening the alliance although moderate and liberal support stays roughly constant. Differences on this issue have increased somewhat, with the shift coming mainly from conservatives.
When we turn to North Korea, questions in the surveys are not phrased in an equivalent way across the years, which may require more caution when comparing findings over time. In 2014 and 2018, respondents are asked whether “aid to North Korea should be increased (대북 지원을 확대해야 한다)”; the corresponding proposition for 2016 and 2020 is “humanitarian aid toward North Korea should continue regardless of the circumstances (상황에 관계없이 인도적 대북 지원은 지속되어야 한다).” As a result of this phrasing, we might expect survey respondents in 2014 and 2018 to have responded more positively than they would have under the alternative formulation of the question. Nonetheless, with this qualification, the differences on giving aid to North Korea seem to fall in a predictable pattern with liberals more favorable, moderates somewhat less so, and conservatives most negative. Polarization may have increased on this issue too, although disaffection with North Korea has increased among all three groups.
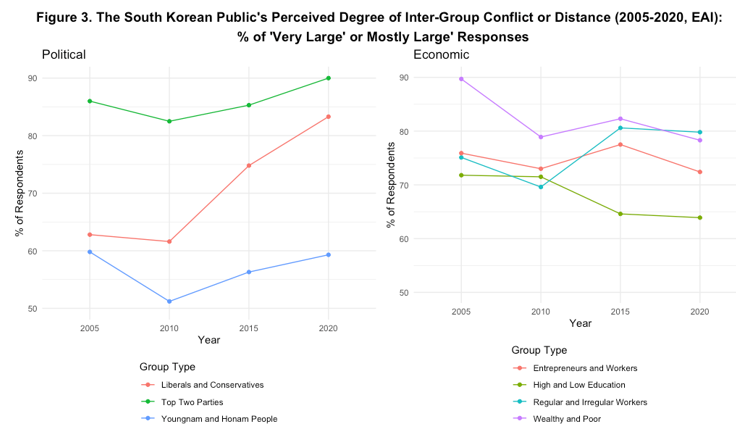
We have thus seen some increase in issue polarization in the Korean electorate on all these issues, with differences across ideological groups increasing on the priority to be given to welfare, on taxing the wealthy, on the alliance with the United States, and on aid to North Korea. We close with a question from a different set of longitudinal surveys conducted every five years by the East Asia Institute (EAI) and others on how the public perceives the degree of conflict or distance across social and political groupings: between the wealthy and the poor, between men and women, and with respect to the classic Yongnam-Honam regional split. But they also probe the perceived distance or conflict between liberals and conservatives and between the two mainstream parties in each respective period, replicating–and confirming–results reported in our last post.
An overwhelming share of respondents see large a large distance or conflict between socioeconomic groups: high education versus low education (63.9%), entrepreneurs versus workers (72.4%), wealthy versus poor (78.3%), and particularly regular versus irregular workers (79.8%). Except for the last division, however, there is no clear trend; the share underlining these divides has not gotten larger. When we look at where the share seeing wide gaps is growing most sharply they are with respect to political—not social—cleavages. The share of respondents who responded there is a “very large” distance or conflict between (political) liberals and conservatives in South Korea increased from 19.3% in 2005 to as high as 42.3% in 2020; on the top two parties, the proportion increased from 37.9% in 2005 to 47.9% in 2020. When we include those who responded “mostly large,” shown in the figure above, the percentage for the top two parties reaches 90% of respondents in 2020, which is higher than any other perceived category of inter-group conflict and even more than those seeing the Youngnam-Honam as large (59.3).
There is no clear marker of when a society is polarized, and political differences are in any case the natural stuff of democratic politics. On some issues, differences across Korean voters appear smaller than one might expect. Nonetheless, the evidence of increasing polarization we presented in our last post is matched here by evidence of increasing political differences on a range of specific issues. Moreover, as noted by some prior studies, when we look at public perceptions of differences across social groups, we find that they do not appear to be growing to the extent of differences across the political divide. The findings suggest that voters may be less divided on policy than they are on political identities. As we have seen from other settings–including the United States–that is not necessarily a good thing.
Yeilim Cheong is a PhD student in the Political Science department at UC San Diego. She received her B.A. in Political Science and Economics (double major) and M.A. in Political Science from Korea University. Stephan Haggard is a Non-Resident Fellow at the Korea Economic Institute and the Lawrence and Sallye Krause Professor of Korea-Pacific Studies, Director of the Korea-Pacific Program and distinguished professor of political science at the School of Global Policy and Strategy University of California San Diego. The views expressed here are the author’s alone.
Photo from Shutterstock.
[1] Other factors listed as primary considerations included party membership (12.7%), political experience (5.3%), evaluations by acquaintances (2.9%), and candidate’s region of origin (0.5%). The overall picture looks similar with a series surveys conducted by the National Election Commission between April and May, 2017 around the time of the 19th Presidential election, where around 45% of respondents said they prioritized the candidate’s personal traits and competence for vote choice, while 34% pointed out policy and election pledges as their top consideration.
Notes on the Data
The first series of data analyzed in this post (Figures 1 and 2) are accessed via the Korea Social Science Data Center and includes the 20th and 21st National Assembly Election Survey (2016 and 2020) and the 6th~7th Local Election Survey (2014, 2018), each jointly conducted by the KSDC (2014, 2016, 2018, 2020) and the Korean Association of Electoral Studies (2014, 2018). The sample size ranges between 1,000 and 1,200 with stratified sampling based on age, gender, and region at a 95% confidence level ± 2.83%. The sample coverage includes the entire South Korean electorate (Jeju Island is excluded in 2016), reflecting the minimum age for voting eligibility at the time of the survey: 20 years old or above (2014), 19 years old or above (2016 and 2018), and 18 years old or above (2020). While there are questions on some of the same issue areas for other years, we limit our analysis to data from 2014, 2016, 2018, and 2020 due to considerable differences in how the questions were worded depending on the year. The survey format for all the surveys is face-to-face interviews with a structured questionnaire for all years, except for 2020 which was in the form of an online survey. Comparing 2020 survey responses to those of prior years may thus require a qualification in consideration of a potential social desirability bias which may have been more present in face-to-face interviews relative to online surveys. It is also worth noting that the composition of individuals who are willing to respond to face-to-face interviews may vary from those who respond to online surveys.
The liberal, moderate, and conservative categorization of respondents in Figures 1 and 2 are based on respondents’ self-identified political ideology. The question asks: “Political ideology is generally distinguished as liberals (left) and conservatives (right). From a scale of 0 to 10, where would you place yourself? Here, 0 indicates liberal and 10 conservative (정치이념을 일반적으로 진보(좌파)와 보수(우파)로 구분합니다. 0부터 10까지 눈금 중에서 00님께서는 자신은 어디에 속한다고 생각하십니까? 여기서 0은 진보를 나타내며, 10은 보수를 나타냅니다).” Liberals are grouped as those who identify between 0 and 3 on this political ideology spectrum; moderates are those between 4 and 6, and conservatives between 7 and 10. Over the respective period, above 97% of respondents were able to locate their own positions on the 0-10 ideological spectrum; the percentage of respondents who identify themselves as moderates ranges between 47.2% (2014) and 54.9% (2016), while that of conservatives is between 17.8% (2020) and 34.2% (2014) and that of liberals is between 16.5% (2014) and 29.3% (2020).
Figure 3 is based on the longitudinal Korean Identity surveys jointly conducted by the East Asia Institute (2005, 2010, 2015, 2020), JoongAng Ilbo (2005, 2010, 2015, 2020), Korea University Asiatic Research Center (2010, 2015), and the East Asia Collaboration Center at Sungkyunkwan University (2020). The question asks respondents how much of a conflict or distance they think there is between each of the provided two groups (“다음 두 집단 사이에 갈등이나 거리감이 얼마나 크다고 생각합니까?”). Possible responses include very large (매우 크다), mostly large (대체로 크다), normal (보통이다), mostly small (대체로 작다), very small (매우 작다), or don’t know. Over the entire period, only around 0~3.1% of respondents chose “don’t know” or did not respond at all, depending on the year.