By Stephan Haggard and Yeilim Cheong
Polarization in Korea Part I: The Public vs. Partisans
While the general electorate in Korea has been relatively stable in recent years, polarization is increasing among political partisans.
This post was revised on August 21 , 2023 to reflect additional research by the authors. Additional analysis can be found in authors’ article Political Polarization in Korea.
Korea’s democracy is clearly a success story. Along with Taiwan, it is one of the few Asian countries that transitioned to democratic rule in the 1980s and has sustained that trajectory without significant “backsliding” or reversion. Nonetheless, new concerns have emerged that Korean politics is becoming more polarized and thus vulnerable to the kinds of stresses on democratic rule visible in the United States.
In this post, we take a long-run view of polarization in Korea. We draw on nationally representative surveys covering the period from 2004–the middle of the Roh Moo-hyun presidency–to 2020. This exercise identifies a baseline for the apparent rise of polarization in the current electoral cycle. The findings are that as of 2020:
- The Korean public–as a whole–has held largely centrist views.
- Not surprisingly, partisans–those who identify with the major left and right parties–hold somewhat less centrist views. The extent of polarization has waxed and waned since 2004, but partisans are more polarized than they have been in the past, with changes coming on both the left and right.
- There has been a widening gap between how South Korea’s two largest parties’ identifiers feel about their own party and the opposite party. However, especially between 2016 and 2020, this affective polarization has been driven more by a sharp rise in dislike towards the other party than by an increase in favorable feelings about their own party.
Growing Polarization? The Public vs. Partisans
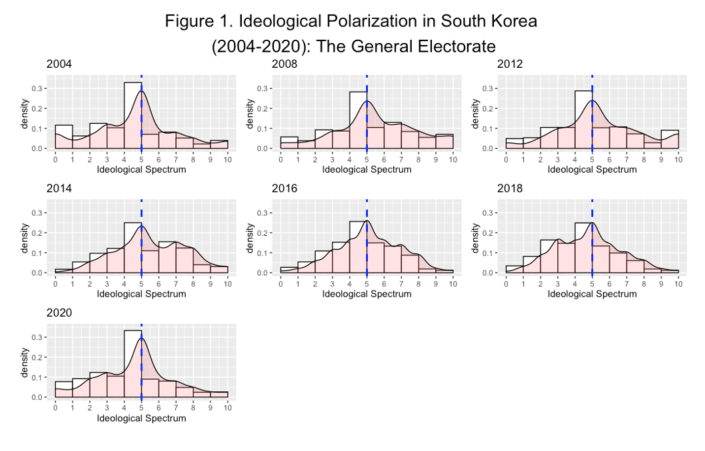
A simple way to measure the extent of ideological polarization is to ask respondents to place themselves on an ideological scale from most liberal to most conservative (0-10), and then to look at the distribution of responses. (In a note at the end of the post, we provide more detailed information on the data used). In less polarized settings citizens should cluster around the middle—say, around a score of 5–with smaller shares of voters identifying themselves at the poles. In more polarized settings, by contrast, we expect a hollowing out of the middle and voters identifying with more ideological positions.
The Korean public as a whole appears quite centrist. Figure 1 shows the distribution of ideological self-identification for a number of years from 2004 to 2020 drawing on data from the Korean Social Science Data Center (KSDC). Despite subtle shifts between more liberal periods (for example, 2004 and again in 2020) and more conservative ones (for example, 2012), a plurality of Korean voters cluster in the middle. Surprisingly, 2020 saw the highest share of Korean voters (33 percent) identifying themselves in the middle of the political spectrum in the whole period from 2004 to 2020.
However, this pattern does not hold when we look at partisans: those expressing a defined partisan identity with either the dominant left or right party. Figure 2 repeats the same exercise in Figure 1 but eliminates non-partisans who account for a surprisingly large share of the Korean electorate: between 45 and 62 percent depending on the year. We also do not consider the views of those who identify with smaller parties on either side of the political spectrum, focusing rather on polarization between the two main parties.
In Figure 2, the areas shaded blue show the ideological orientations of those who identify with the dominant left party at the time (from the Uri to the Democratic Party). The shaded red area does the same for the right parties (from Hannara to the United Future Party). The dotted lines show the median ideology scores for partisans of the two dominant left and right parties: for each party, there are an equal number of partisans to the left and to the right of this median point.
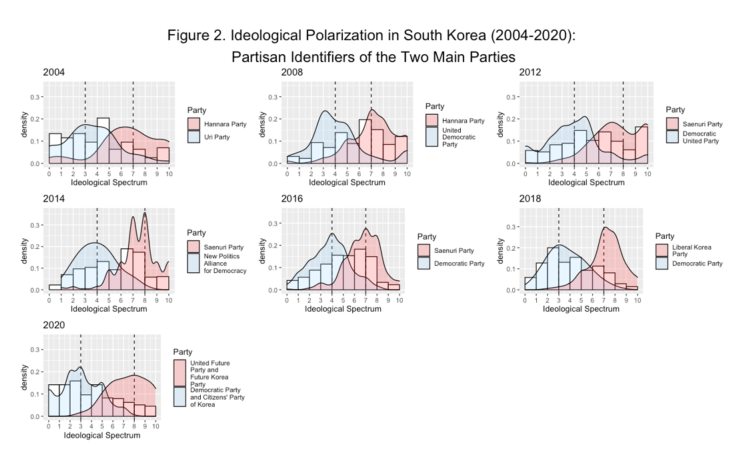
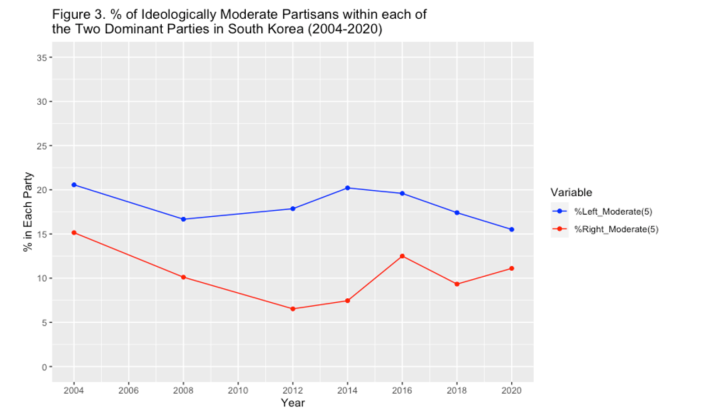
Several measures of polarization are worth noting. First, in 2004 we see that the ideological self-identification of partisans overlaps to a surprising degree; about 21 percent of those identifying with the left party and 15 percent of those identifying with the right party placed themselves in the ideological middle (i.e., 5 on the 0-10 scale). As Figure 3 shows, however, these numbers have fallen over time and by 2020, 16 percent of those identifying with the dominant left party put themselves in the ideological middle and only 11 percent identifying with the dominant right party at the time.
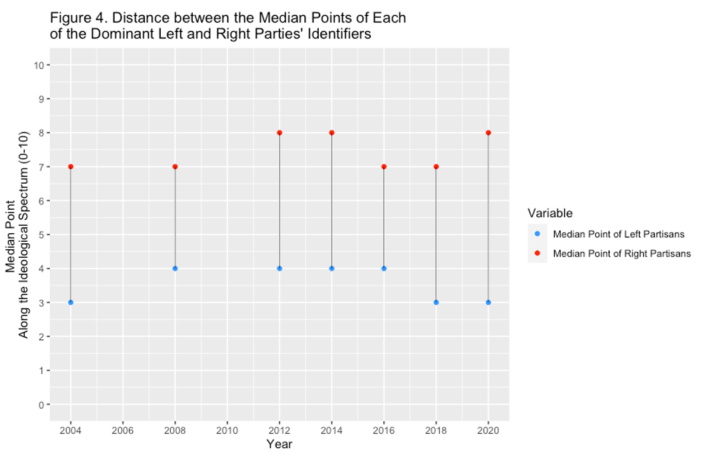
Second, if we focus on the differences in the medians between the two parties, we can see that they tend to oscillate over time but within a fairly narrow band but became more polarized in 2020. For example, Figure 4 shows that in 2004 the median point of the dominant left party was 3, that of the dominant right party was 7 for a distance between the medians of 4. This number fell back to 3 in 2008, suggesting less polarization. In subsequent periods, this indicator suggests somewhat more polarization in 2012 and 2014 (because of movements on the right) and in 2018 (because of movement on the left). However, in 2020, the distance in the median point between the dominant left and right parties’ partisans increased to 5, the largest ideological distance in terms of the two parties’ median points over the entire sample period.
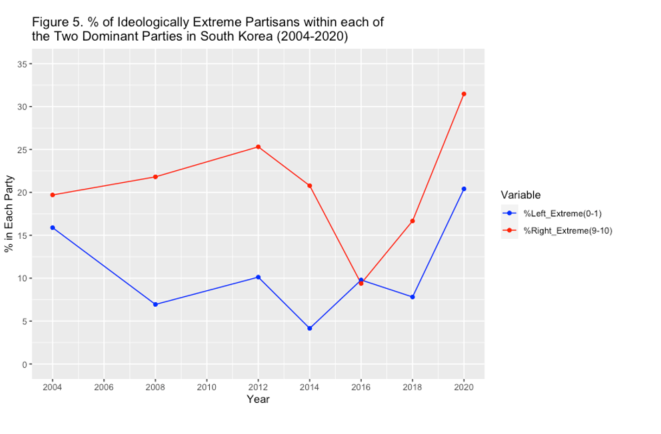
A final measure of the extent of polarization is to focus on the extremes and ask, “what share of each party identifies itself at the ideological poles of either left (self-placement of 0 or 1) or the right (9 or 10). We graph these in Figure 5. While the percentage of ideologically extreme partisans within each party has shown ups and downs throughout the sample period, it reached the highest level for both parties in 2020. The share has nearly tripled from 7.8 percent to 20.4 percent within the left party, while almost doubling from 16.7 percent to 31.5 percent within the right party.
Affective Polarization? Dislike Thy Neighbor
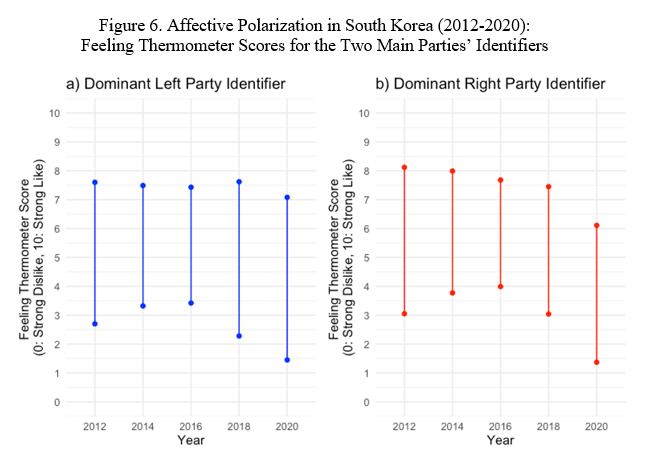
Is there evidence that the partisan landscape has not only shifted ideologically, but that partisans have more negative views of the opposite party? We can only report data from 2012 to 2021 because the precise question was not posed in the same way before 2012. The survey collects what pollsters call “feeling thermometer” scores: 0 is the “coldest” or most negative possible view of a given party and 10 the “warmest” or most positive. We consider those who identify with the dominant left (blue) and right (red) parties separately. In these plots, the top score reflects feelings about the respondents’ own party; the bottom scores are the feelings expressed about the other party.
Over the period under analysis, we see an overall rise in affective polarization with a widening gap between feelings toward their own party and the opposite party, especially between 2016 and 2020. However, this pattern is driven mostly by an increase in out-party dislike rather than that of in-party like. The in-party sentiments of individuals who identify with the left-wing party remained fairly consistent from 2012 to 2018, but subsequently declined in 2020. For those on the right, there was a gradual fall in their view of their party from 2012 to 2018, then followed by a significantly steeper decline in 2020. The evident surge in dislike towards the opposing party, without a corresponding increase in favorability towards one’s own party, may indicate the public’s rising disappointment and exhaustion with the country’s party politics overall.
Conclusion: Into the Elections
Taking a long-term view of polarization in South Korea, we find a mixed, half-empty, half-full picture. In line with research on both the United States and Taiwan, we see a relatively stable ideological “middle” in the general electorate; we found that roughly half of all respondents did not identify with either major party and that these voters tend to have centrist views. In 2020, the share of the overall electorate which locates on 5 along the 10-point scale reached 33 percent, the highest share over the entire period.
Yet this finding does not hold when we consider partisans: those who do identify with one of the two major parties. The changes are arguably subtle rather than wholesale. And they may be exaggerated because of trends during election years where both parties seek to exploit a hot button issues to paint their opponents in the most negative light. Nonetheless, we see some erosion in both parties of those who identify as moderate, an increase in those with more liberal or more conservative orientations and a corresponding increase in ideological distance between the parties. Affective distaste for the opposition has increased on the right in particular.
The election year poses the question of whether polarization will worsen or stabilize going forward. The election campaigns have been particularly negative and ad hominem this cycle, focused on scandals and irregularities surrounding the candidates, their family members, or close acquaintances. Corruption looms large as an issue, and on both sides. And the current election has seen polarizing narratives, for example on issues of gender and Yoon’s proposal to abolish the Ministry of Gender Equality (or Women) and Family. Yet recent polls suggest that the public at large–including those citizens in the center–are concerned primarily about bread-and-butter questions: economic recovery, the real estate market, and responses to COVID 19. Next time: a closer look at how the public has divided in their policy preferences with respect to these and other issues over time.
Yeilim Cheong is a PhD student in the Political Science department at UC San Diego. She received her B.A. in Political Science and Economics (double major) and M.A. in Political Science from Korea University. Stephan Haggard is a Non-Resident Fellow at the Korea Economic Institute and the Lawrence and Sallye Krause Professor of Korea-Pacific Studies, Director of the Korea-Pacific Program and distinguished professor of political science at the School of Global Policy and Strategy University of California San Diego. The views expressed here are the author’s alone.
Photo from Teddy’ Cross’ photostream on flickr Creative Commons.
Notes on the Data
The data accessed through the KSDC for each of the years under analysis includes the 17th~21st National Assembly Election Survey (2004, 2008, 2012, 2016, 2020) and the 6th~7th Local Election Survey (2014, 2018). Each of these surveys were jointly conducted by the KSDC (2004, 2008, 2012, 2014, 2016, 2018, 2020), the Korean Association of Electoral Studies (2004, 2014, 2018), the CSES Korean Research Institute (2008), and the National Election Commission (2012). The sample size ranges from 1,000 to 1,500 and are all conducted by face-to-face interview with a structured questionnaire, except for 2020 which took the form of an online survey. All the surveys use stratified sampling according to region, gender, and age, with a 95% confidence level ± 2.5~3.1%. Reflecting changes over time in the minimum age for voting eligibility, the sample covers the whole South Korean adult population of 20 years old or above (2004, 2008, 2012, 2014), 19 years old or above (2016, 2018), or 18 years old or above (2020). The sample coverage in 2004, 2008, 2012, and 2016 excludes Jeju Island.
Partisan identifiers are those who answered “yes” to the question “Is there a party that you feel close to?” (or in Korean, “가깝게 느끼는 정당이 있습니까”, “선생님께서는 평소 특정 정당에 대해서 가깝다고 생각하십니까?”). Among those who answered “yes,” partisan identifiers are those who respond with the dominant left and right parties of the time to the follow-on question: “If so, which of the following parties is that?” or “If so, which of the following parties do you feel the closest to?” (or in Korean, “그렇다면 그 정당은 어디입니까” or “(그렇다 또는 있다라고 응답한 경우) 가장 가깝다고 느끼는 그 정당은 어느 정당입니까?”). Over the sample period, between around 69 and 96 percent of all respondents who identify with any political party responded that they identify with either the dominant left or dominant right party of the time.
Prior to 2020, other centre-left or left parties (e.g., Unified Progressive Party, Justice Party) and right or centre-right parties (e.g., Bareunmirae Party, People Party) are excluded. However, for the year 2020, the Citizens’ Party of Korea (더불어시민당) and Future Korea Party (미래한국당) are each included in the dominant left and right party respectively as they were considered “satellite parties” of the Democratic Party (더불어민주당) and United Future Party (미래통합당); we conducted the same exercise excluding the parties and the results were broadly the same. For the year 2004, when there was a significant third party vote, we also repeat the exercise including both the Democratic Party (민주당) and Uri Party (열린우리당) as the left party; the results also remain largely consistent except that the median point among the left party identifiers moves closer to the middle from 3 to 4.
The question on political ideology reads: “Political ideology is generally distinguished between liberal (left) and conservative (right). Where would you place yourself and the following list of political leaders [the latter are recorded as separate responses] on a spectrum from 0 to 10, where 0 means liberal and 10 means conservative?” (or in Korean originally, “정치이념을 일반적으로 진보(좌파) 보수(우파)로 구분합니다. 0부터 10까지 눈금 중에서 00님께서는 자신은 어디에 속하며. 정치지도자들은 어디에 속한다고 생각하십니까? 여기서 0은 진보를 나타내며. 10은 보수를 나타냅니다.”). We exclude consideration of those who respond “I’ve never heard about the party”, “decline to answer”, “don’t know”, or simply refuse to answer. Over the surveys included here, over 70% of respondents were able to identify themselves on the left-right spectrum
There are feeling thermometer scales for the period prior to 2012 (e.g., 2010). However, we leave out these years because the structure, wordings, and score range of the feeling thermometer questions are considerably different from those since 2012. The feeling thermometer scale question is worded as follows: “I’d like to know what you think about our country’s political leaders [recorded as separate responses] and political parties. As I read you the names of each party, please select a score on a spectrum that ranges from 0 to 10. “0” means you strongly dislike the party and “10” means you strongly like the party. If you have never heard of or do not know much about the party that I read aloud, just tell me so” (“00님께서 우리나라 정치지도자와 정당들에 대해서 어떻게 생각하고 계신지 알고 싶습니다. 제가 각 정당의 이름을 읽어 드리면, 0부터 10까지 눈금 중에서 하나를 선택해 주십시오. 여기서 0은 매우 싫어한다는 것을 의미하며, 반대로 10은 매우 좋아한다는 것을 의미합니다. 혹시 제가 읽어 드린 정당에 대해 들어본 적이 없거나 별로 아는 바가 없으시면, 그렇다고 말씀해 주시기 바랍니다.”). Reverse preference responses, defined as those who identified with party A but whose feeling thermometer scores for party B were higher (i.e., more positive) than that for their identified party A, are excluded from analysis.