
Search All Site Content
Total Index: 6330 publications.
Subscribe to our Mailing List!
Sign up for our mailing list to keep up to date on all the latest developments.
The Peninsula
KORUS Trade Statistics – Part II
Published May 15, 2014
Category: South Korea
By Phil Eskeland
Just prior to President Obama’s recent trip to Asia, critics of the Trans Pacific Partnership (TPP) blamed the Korea-U.S. Free Trade Agreement (KORUS) for the “exploding” U.S. trade deficit with South Korea. Thus, opponents of FTAs use this specific bilateral trade statistic to argue against TPP and providing Trade Promotion Authority (TPA) for the President. As raised in a previous post, there are legitimate explanations for the higher U.S.-Korea trade deficit in 2012 and 2013 as a result of a decrease in U.S. corn and coal exports to Korea because of the drought in the U.S. and a change to Korea’s energy mix – nothing to do with KORUS. Plus, opponents of KORUS and TPP only focus on U.S. merchandise exports and ignore the growing U.S. trade surplus in services.
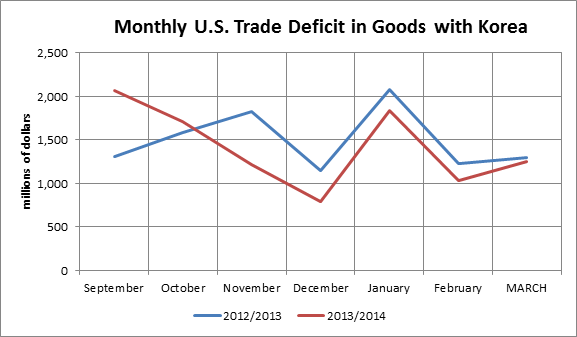
Regardless, even if one agrees with the premise of the TPP opponents, the most recently released monthly merchandise trade statistics from the U.S. government reinforces the conclusion that the 2014 U.S. trade deficit with South Korea is on a track to be less than last year. For March 2014, the pattern of a lower monthly bilateral trade deficit was repeated when compared to the last year’s level – this time, the U.S.-Korea trade deficit was $43 million less than the March 2013 level.
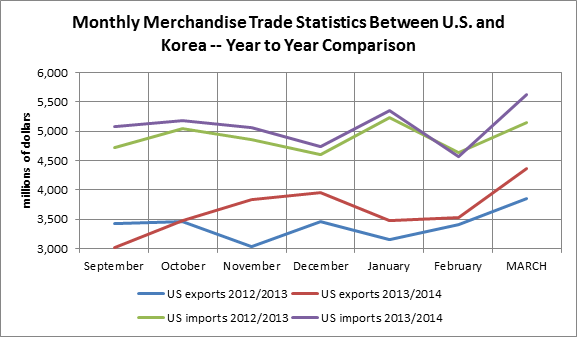
 Source: Foreign Trade Division, U.S. Census Bureau
Once again, the reason for this lower bilateral trade deficit is that U.S. exports to Korea in March 2014 soared to a record level of $4.36 billion, even higher than experienced in March 2012, the first month of the implementation of KORUS. In fact, U.S. exports to Korea last March were $511 million more than the level seen in March 2013 even as U.S. imports from Korea grew to $5.6 billion. This demonstrates that KORUS is a win-win for both sides.
Source: Foreign Trade Division, U.S. Census Bureau
It is important to point out again that there could be anomalies in any month-to-month trade statistic that could detract from this progress. However, the six-month trend looks positive, particularly as more and more U.S. products, starting in March, received even better treatment in Korea as both sides entered the third year of the implementation of KORUS.
So, take it with a grain of salt whenever anti-trade advocates use bilateral U.S.-Korea trade statistics as a rationale to oppose TPP and TPA. Ask them if they are using the latest information available.
Phil Eskeland is the Executive Director of Operations and Policy for the Korea Economic Institute of America. The views expressed here are the authors alone.
Photo from InSapphoWeTrust’s photostream on flickr Creative Commons.